 Faculty Author: David J. Reibstein
Students allocate marketing resources in a simulated environment, using several allocation models and levels of portfolio complexity
In the real world, decisions about marketing allocations can seriously affect profit levels. To prepare students in making these
decisions, instructors can provide them with a theoretical foundation. But how can students get practical, hands-on experience?
Like many of the Learning Lab applications, the Resource Allocation Teaching Environment provides experiential learning by challenging students with realistic scenarios in a virtual MarketSpace.
Students that participate in RATE employ the same skills that would be required in a real business situation. In this case, however, a poor allocation decision results only in a learning opportunity and not in a disappointing return for the company’s shareholders.
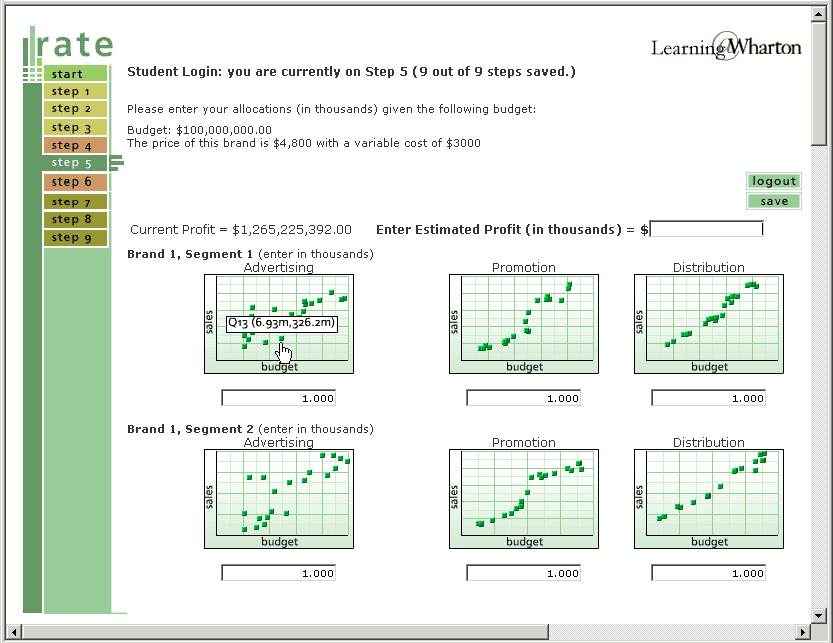
RATE allows marketing students to experiment with different resource allocation models in a simulated market environment. Provided with information on product costs and pricing, historical data, and available budget, students make advertising, promotion, and distribution allocations for various brands and segments. They also estimate expected profit levels.
The simulation steps the students through a progression of increasingly complex portfolios. By the time they reach the final stage of the application, they must allocate resources for multiple brands, with multiple segments per brand.
Administration and Analysis
Once the students have entered their allocation decisions, the application computes the resulting profit levels. A powerful administrative interface provides easy access to the data and analysis. Professors can view the results as a text report with data sortable by name, forecasted profit, and actual projected profit. The application also provides a number of feature-rich, interactive graphs which can be used to help students see the relationship between allocation decisions and profit levels.
The sample graph below plots all the students’ allocation decisions for the first portfolio. If the professor chooses to display profit levels, he or she can click on any profit point to examine the allocation choices which resulted in that particular profit level.
The professor can obtain additional information about a particular student’s allocations by selecting one of his/her data points and clicking on the ‘open graphs’ button. This opens a window which displays the student’s total budget, spending, forecasted profit, and actual projected profit for that portfolio. The student’s allocation levels are plotted against the advertising, promotion, and distribution curves. These graphs are available for every student and for every portfolio. The allocation plotting and profit level charts are also available for every portfolio, as are the text reports.


